
By Carlos Raimundo, VP Product at Paz.ai ~10 min read
A few weeks ago, I was running competitive benchmarks across AI shopping engines for the footwear category. We track how brands appear in ChatGPT, Google AI, and Perplexity, the platforms where a growing number of consumers now ask for product recommendations instead of typing keywords into a search bar.
I was looking at the usual suspects: Nike, Adidas, New Balance, Reebok. One brand's numbers stopped me mid-scroll.
Nike was appearing in every single shopping query we tracked. All of them. Their average position was 2.8, meaning when AI recommends sneakers, Nike is typically the second or third product mentioned. Across 50 competitors in footwear, they sat at #1 by a comfortable margin.
None of this was shocking. Nike is Nike. But what I didn't expect was where the advantage came from. When I pulled apart their product data (the structured markup, the attributes, the descriptions AI engines parse to form recommendations), the picture got more interesting than "big brand wins."
Nike's dominance in AI shopping traces back to how their product catalog is built. And the gaps in their data are just as revealing as the strengths.
A different kind of discovery
Before diving into the data, here's what "AI shopping" means in practice.
When someone asks Perplexity "what are the best running sneakers with air cushioning under $150?" the engine doesn't scan ads or crawl search results pages. It evaluates product data directly. Structured attributes, schema markup, review signals, contextual descriptions. It decides which products meet the criteria, then assembles a recommendation.
The implication is simple: if your product data doesn't give the engine what it needs, your product doesn't get included. Not ranked lower — excluded entirely. And that exclusion is silent. There's no "page 2" in a ChatGPT response.
Product data readiness determines whether a brand enters the conversation at all. Pricing, promotions, brand awareness: none of it matters until the product makes it through that initial evaluation.
Nike's monitoring dashboard: the full picture
Here's what Nike's overview looks like:
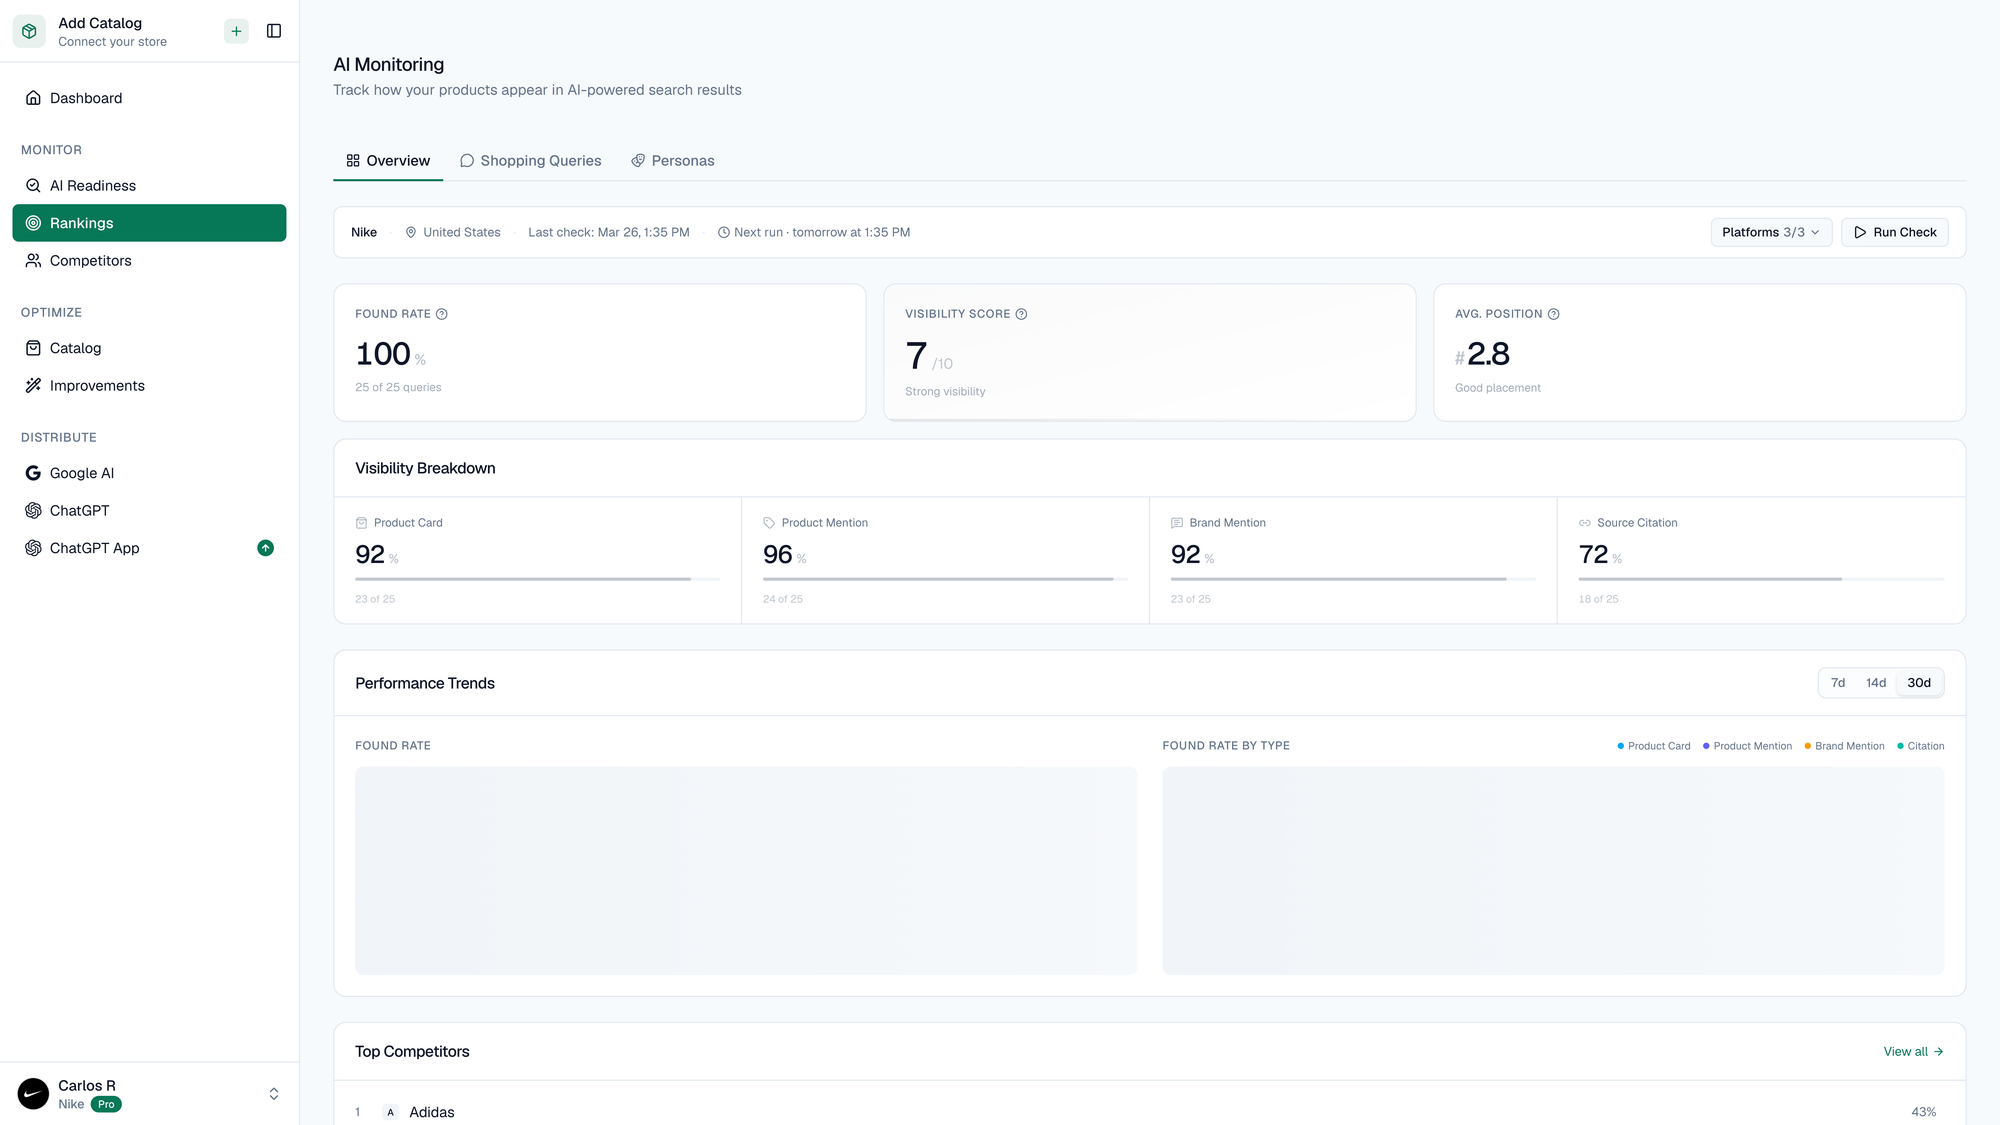
Three numbers anchor this view:
- Found Rate: 100. Nike products appeared in 100% of the shopping queries we tracked across the footwear category. That's not a rounded number. Literally every query.
- Visibility Score: 7/10, with an upward trend. This measures presence and prominence: how high Nike appears when it's found, and whether it's mentioned as a recommendation or a passing reference.
- Average Position: 2.8. When AI platforms list products, Nike is typically listed as the second or third option.
The Visibility Breakdown tells a per-dimension story. Across all LLMs, product mentions, direct recommendations, and source citations, the scores range from 72 to 96. The weakest dimension is source/citations at 72.
The competitive landscape: 50 brands, one clear leader
The competitive intelligence view gives this context.
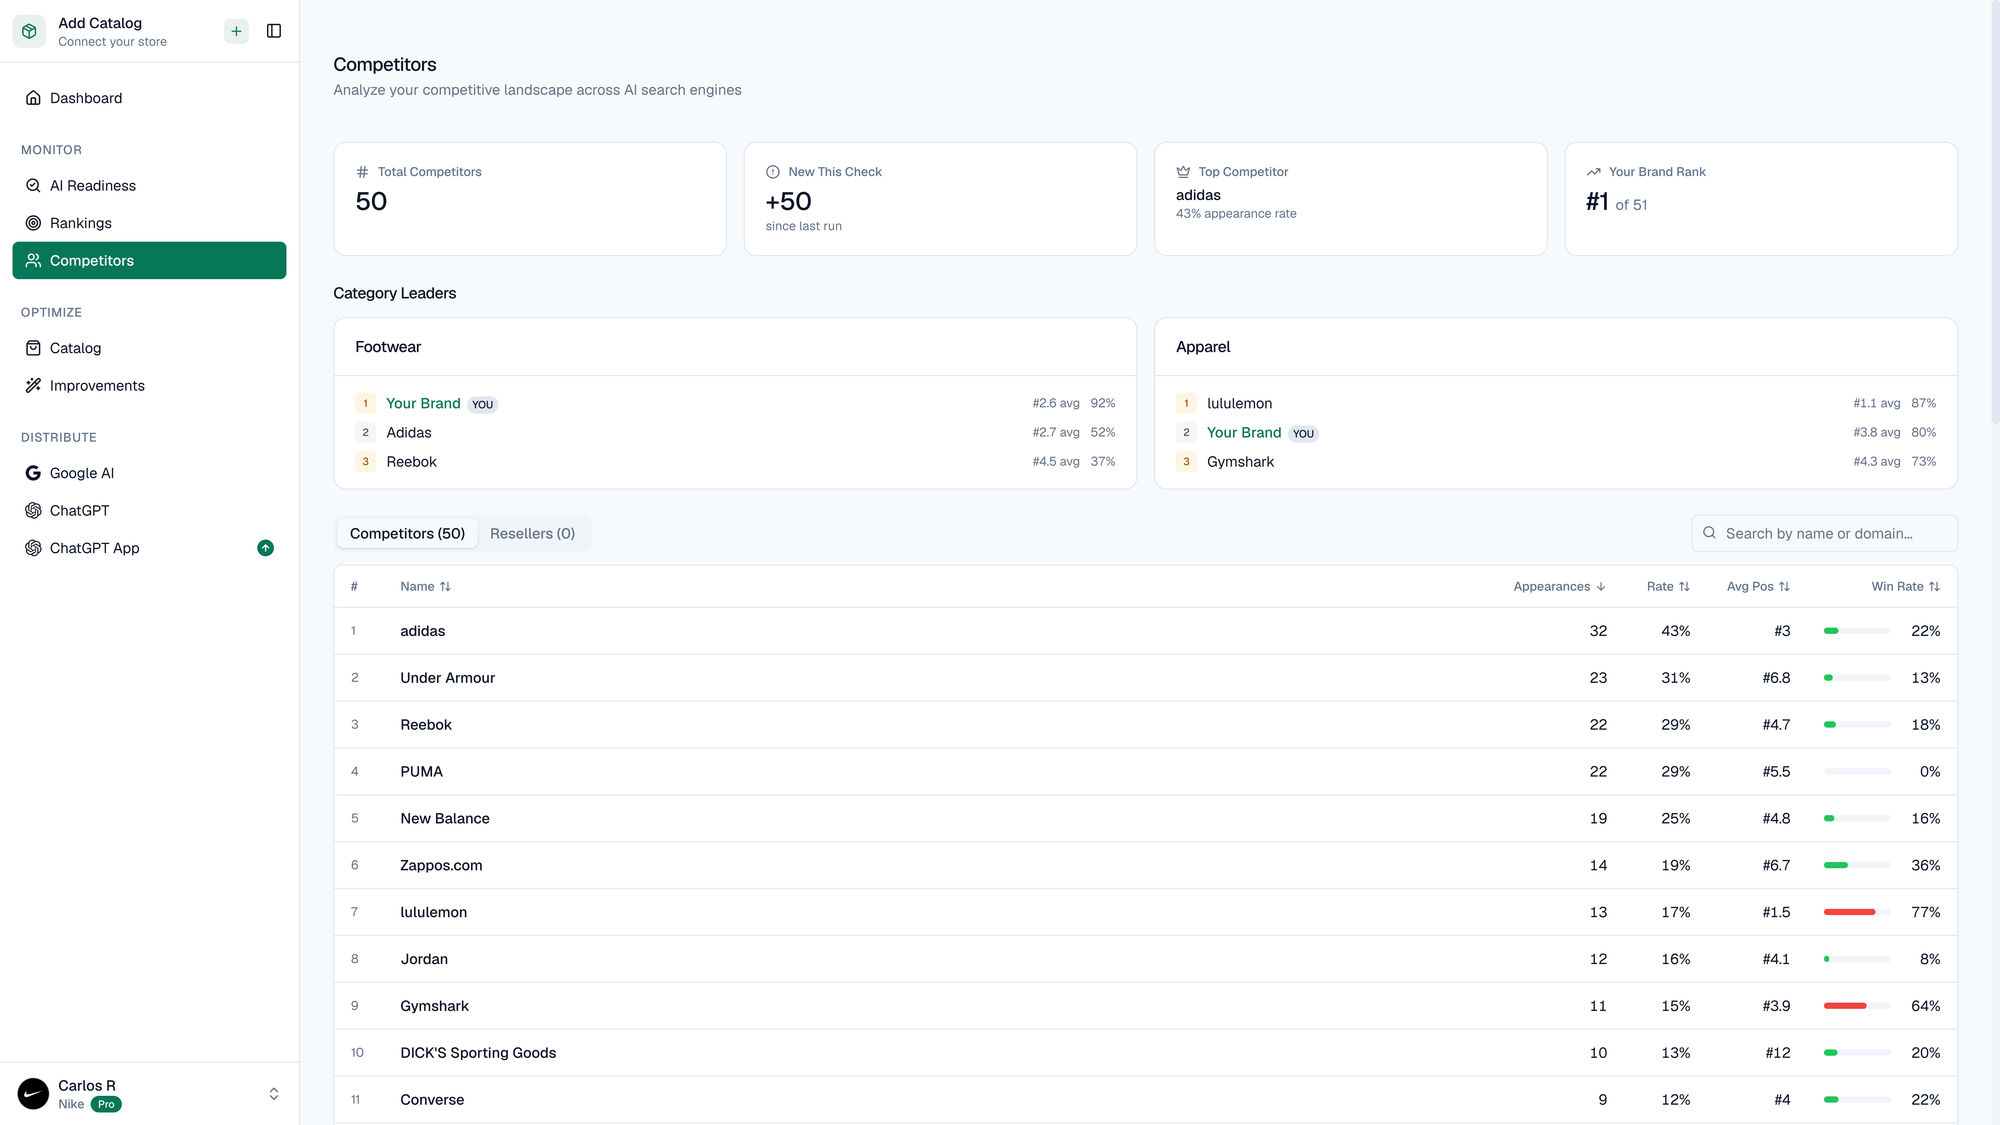
Nike sits at #1 in footwear, with Adidas and Reebok rounding out the category leaders. The competitor table lists all 50 tracked brands (Adidas, Under Armour, Reebok, PUMA, New Balance, Zappos.com, lululemon, Jordan, Gymshark, DICK'S Sporting Goods, Converse, and more), each with their appearance rate, average ranking, and win rate trends.
What stands out is the size of the gap. Adidas, the world's second-largest sportswear brand, appears in 32 of the tracked queries. Under Armour in 23. Reebok in 22. Nike is in all of them. The dropoff from first to second place is steep, and it only gets steeper down the list.
The queries that matter
Visibility metrics are useful. But the substance is in the questions consumers ask, and which brands the AI selects in response.
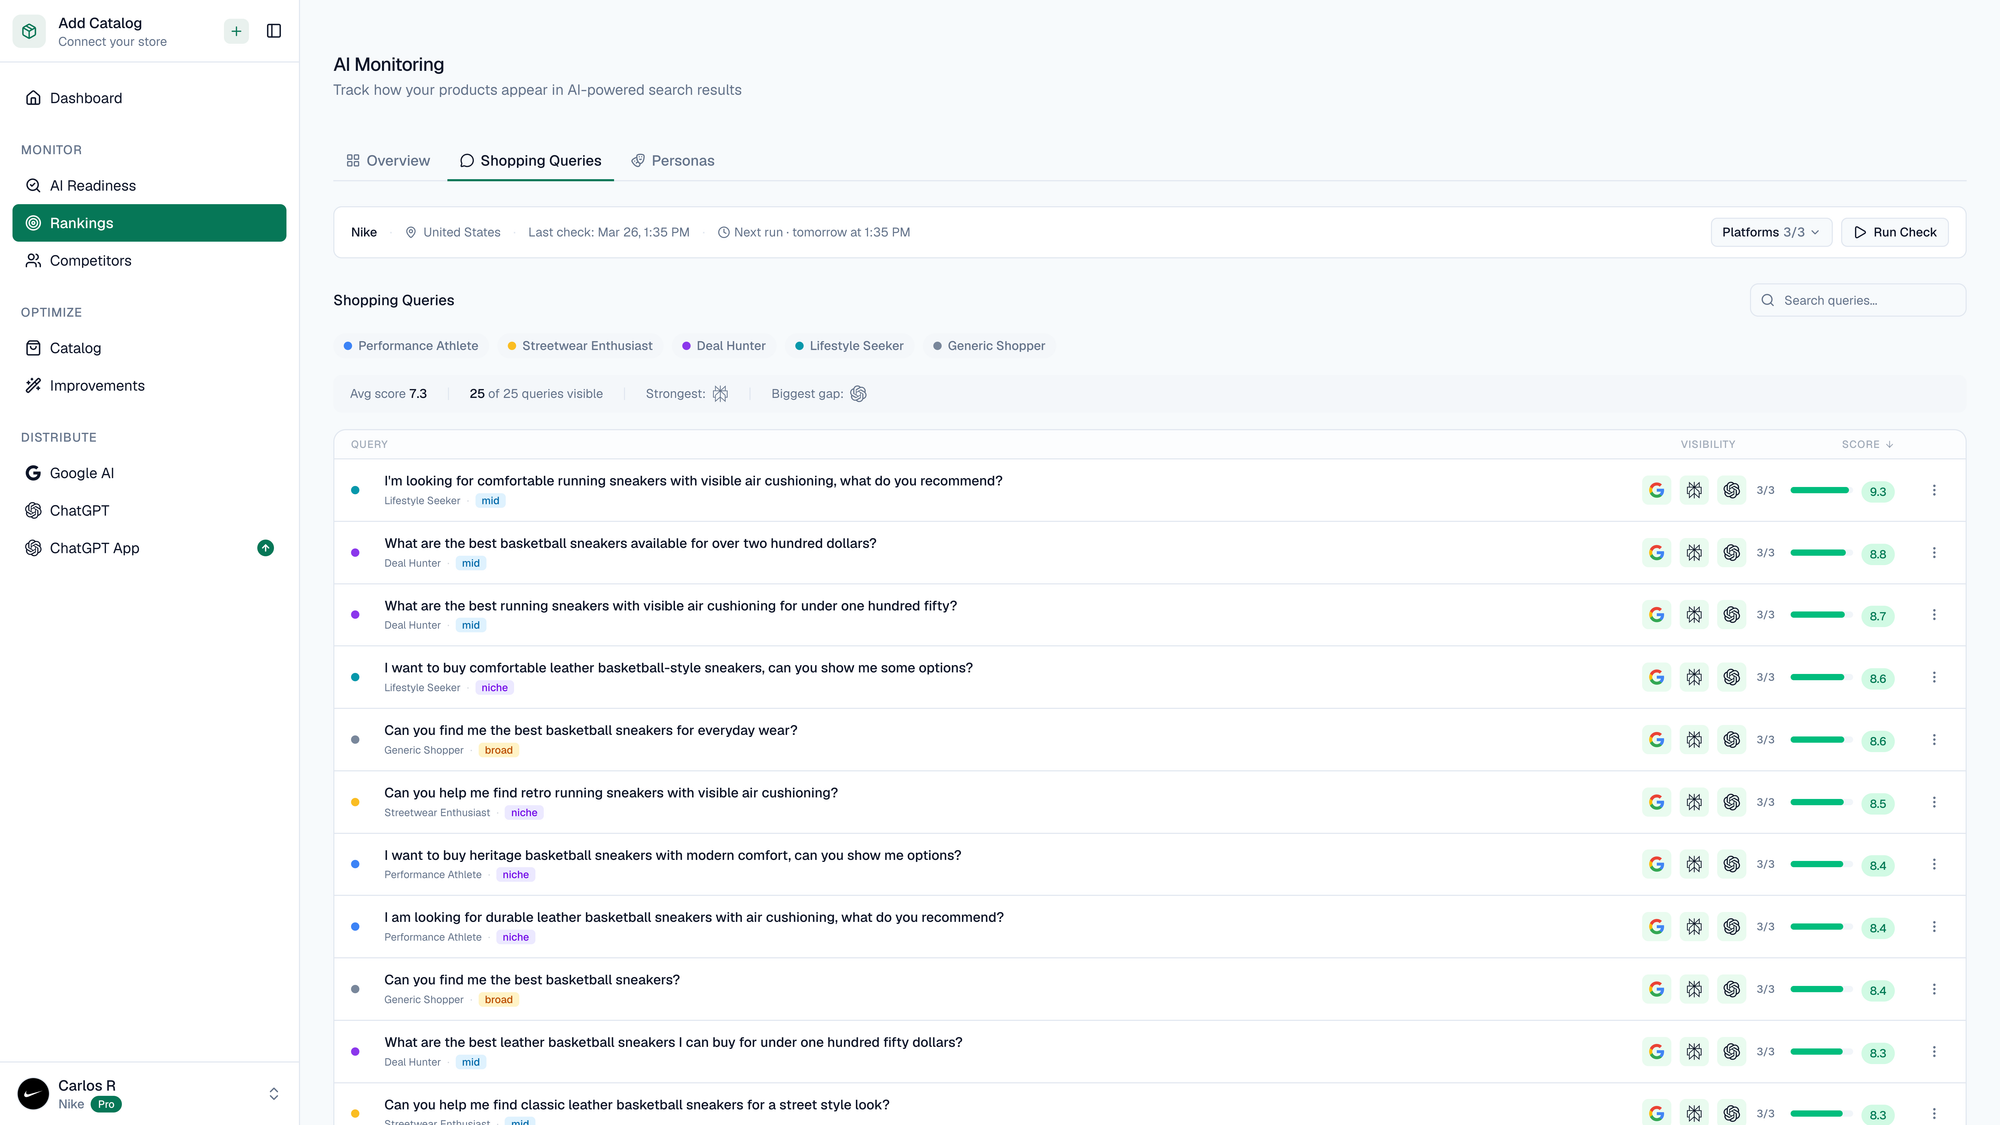
The Shopping Queries view shows every tracked query with per-platform results. Look at some examples of what people are asking:
- "I'm looking for comfortable running sneakers with visible air cushioning, what do you recommend?"
- "What are the best basketball sneakers available for over two hundred dollars?"
- "What are the best running sneakers with visible air cushioning for under one hundred fifty?"
- "I want to buy comfortable leather basketball-style sneakers, can you show me some options?"
- "Can you find me the best basketball sneakers for everyday wear?"
- "I want to buy comfortable basketball sneakers, can you show me options?"
- "Can you help me find classic leather sneakers for a street style look?"
These are not branded queries. Nobody is asking for Nike by name. These are category questions with buying intent, the kind that force AI engines to evaluate products on their data quality rather than brand recognition.
Nike wins across nearly all of them. The green indicators spanning Google AI, Perplexity, and ChatGPT show consistent presence, and it holds across platforms. Whatever Nike is doing with their product data, it works broadly.
The view also segments queries by shopper persona (Performance Athletes, Sneakers & Footwear enthusiasts, Deal Hunters, Lifestyle shoppers, General Shoppers), and Nike's coverage spans all of them.
Head-to-head: Nike vs. Adidas
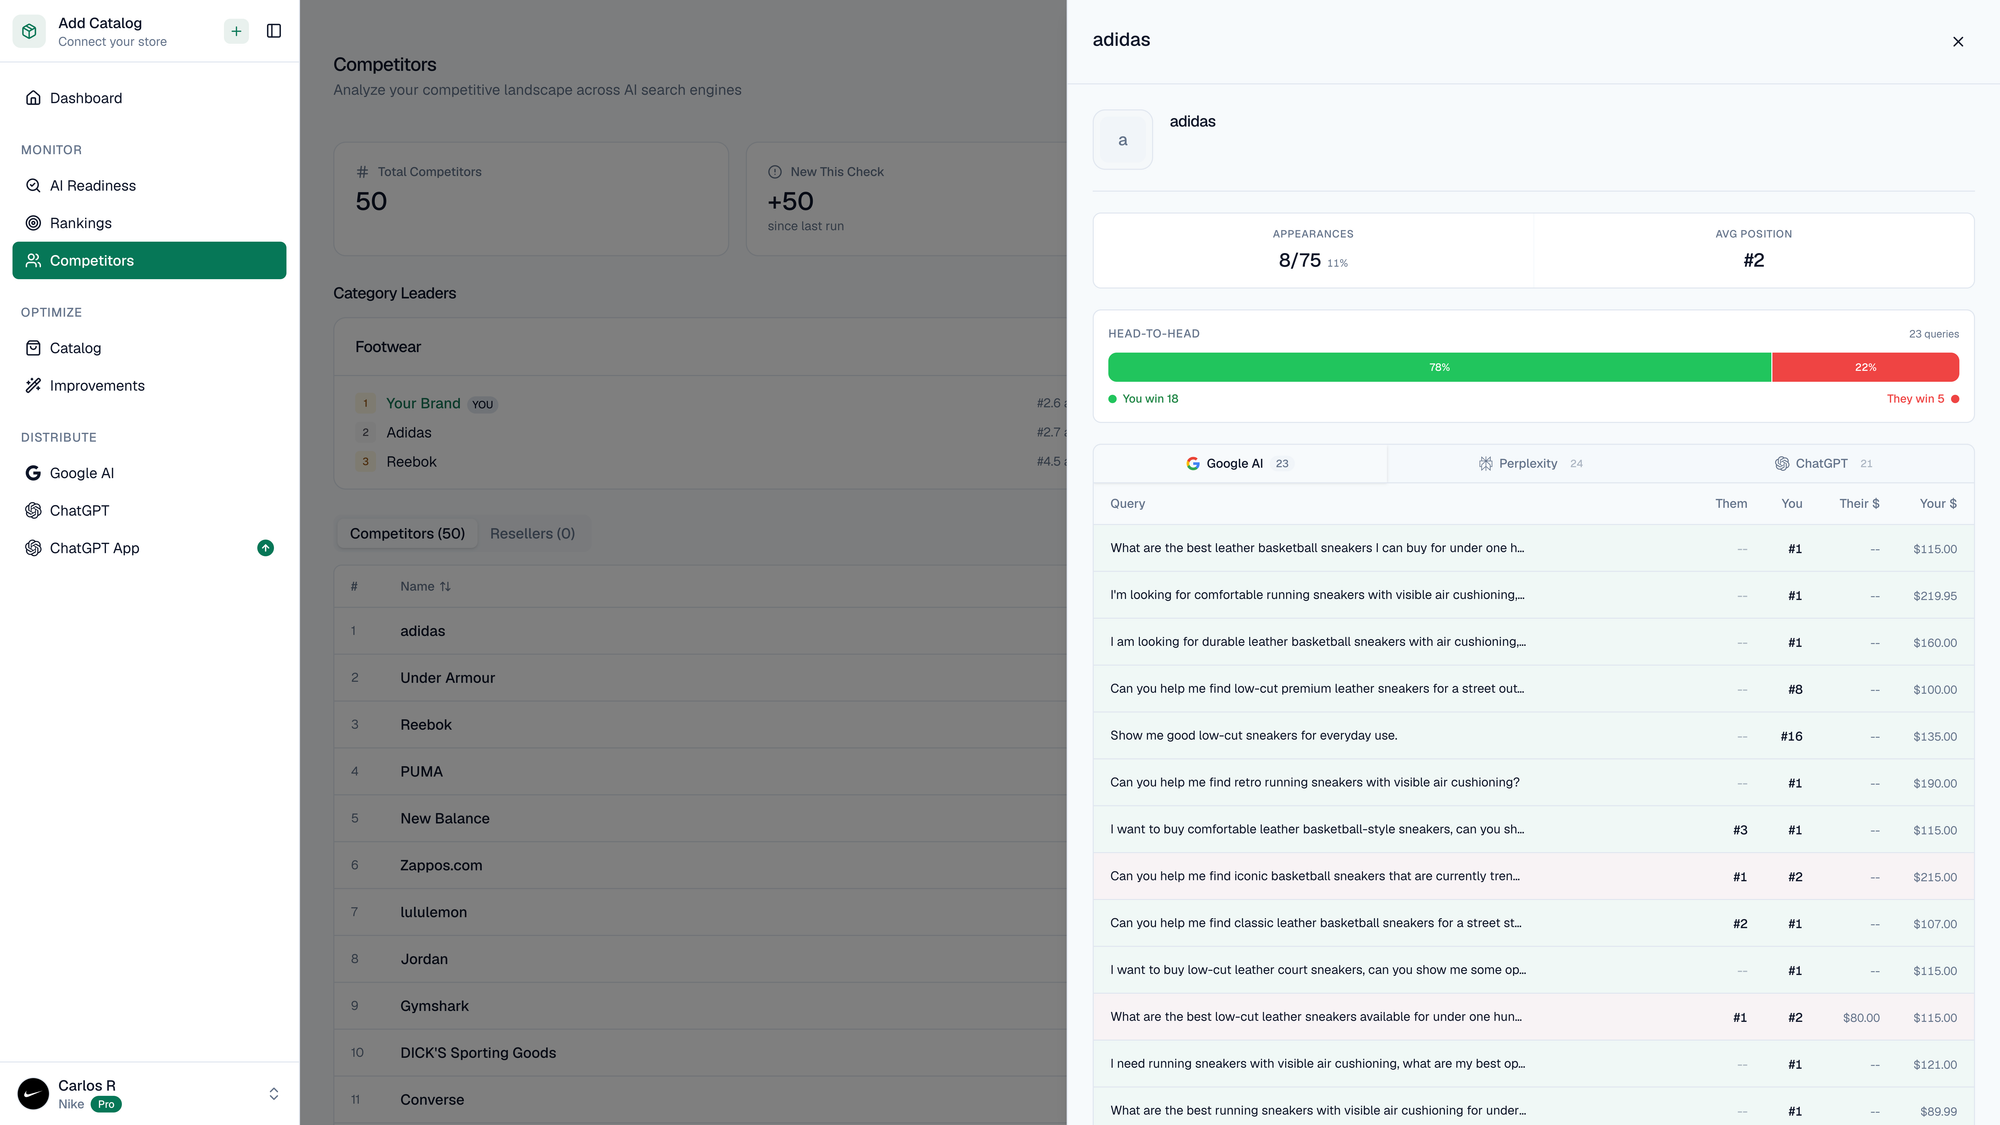
Drilling into the Adidas matchup makes the gap concrete. Adidas appears in roughly 8 out of 75 tracked queries, a fraction of Nike's coverage. When Adidas does appear, their average position is #2. The win/loss share bar tells the competitive story at a glance: Nike wins the majority of direct matchups.
The per-query breakdown is the most useful part. It shows exactly which shopping questions Adidas wins on, which Nike wins on, and on which platform.
Inside the product data: Air Jordan 1 Mid
To understand why Nike wins, look at what AI engines see when they evaluate a Nike product.
I ran an AI readiness report on one of their best sellers, the Air Jordan 1 Mid Shoes, to get the full breakdown.
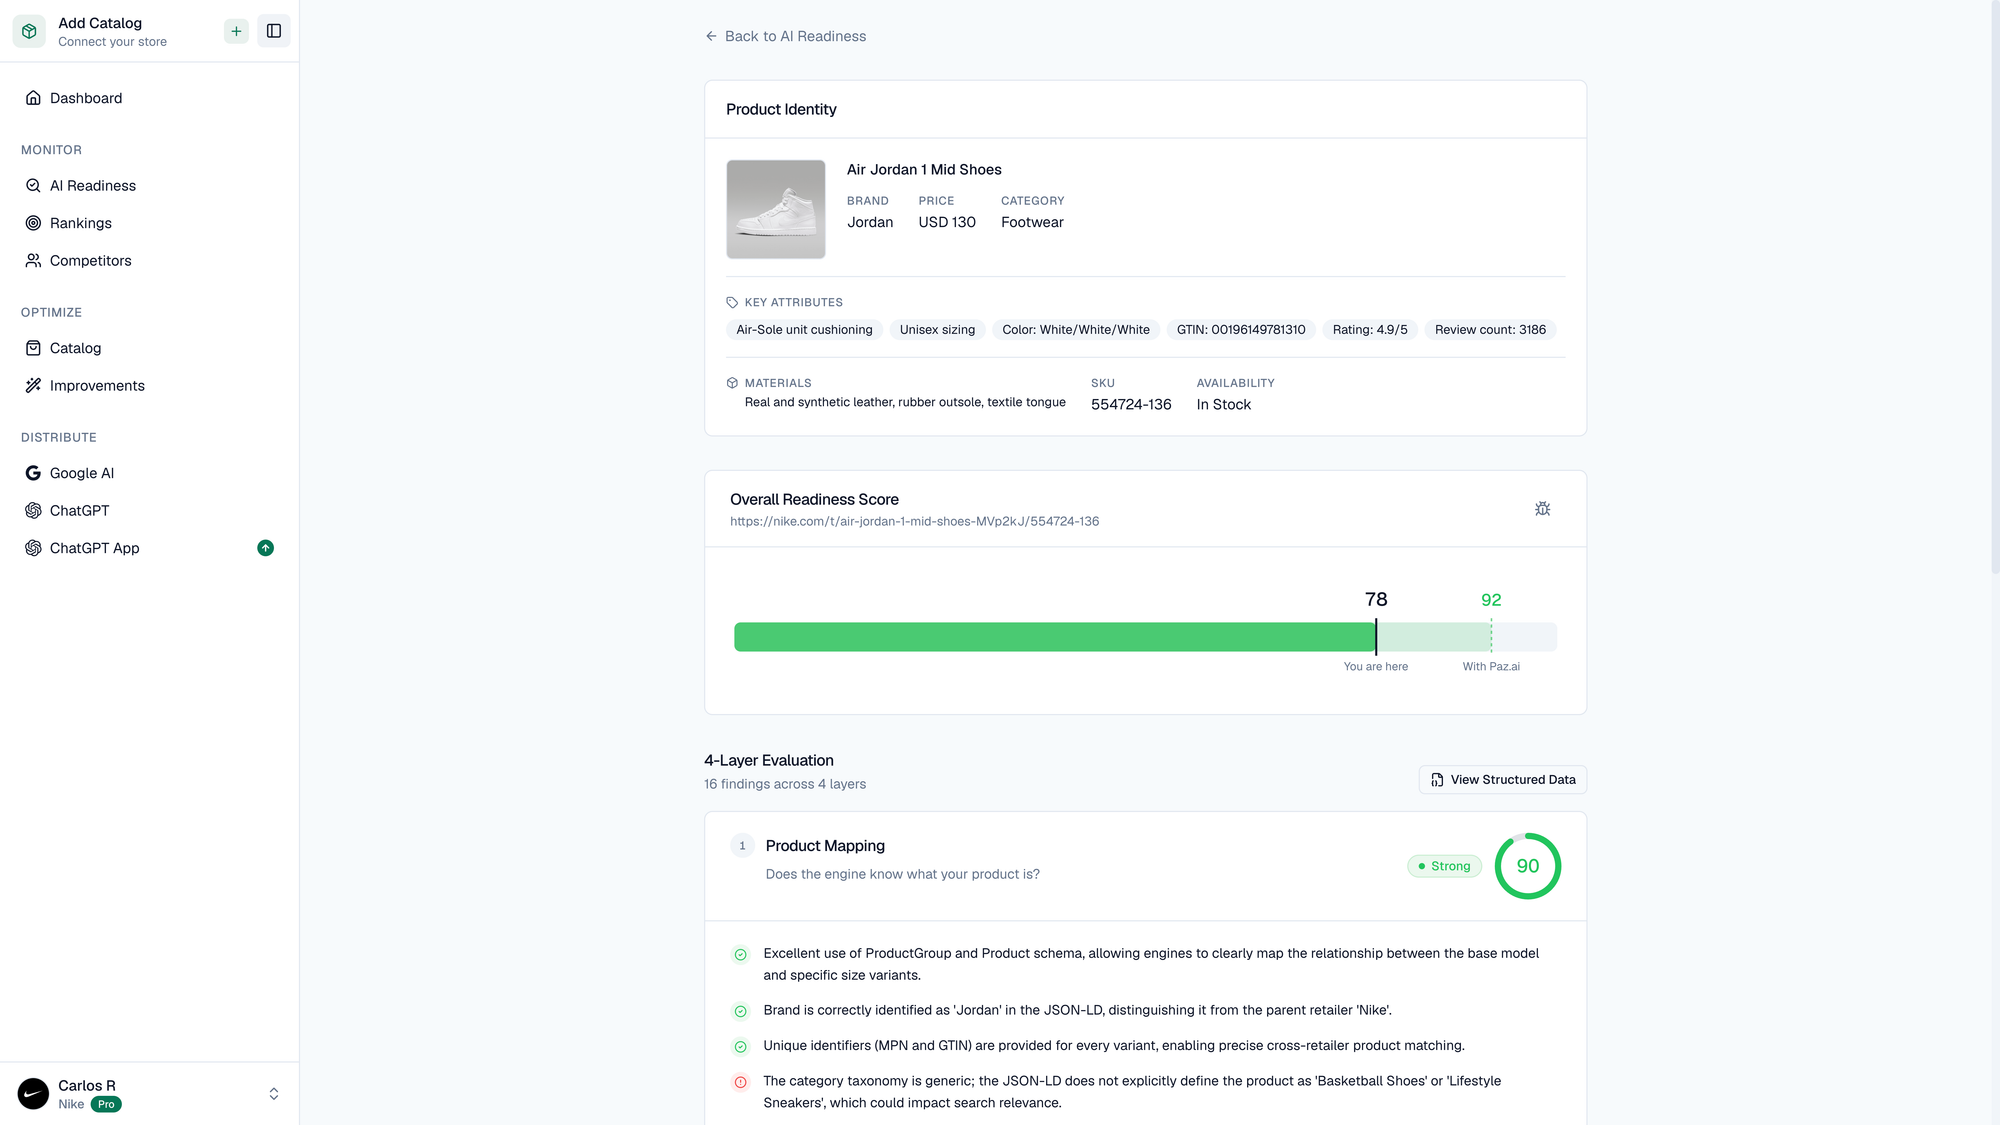
The report pulls everything an AI engine can extract from the product page: brand (Jordan), category (Footwear), key attributes (Air Sole and Cushioning, Unisex Styling, colorways, GTINs), materials (real and synthetic leather, canvas, textile), a 4.5-star rating across 2,186 reviews, current pricing, and in-stock status.
The overall score: 78 out of 100. Categorized as "Strong" on our readiness scale.
The story is in the breakdown across four evaluation layers.
The four layers of AI readiness
Our readiness analysis evaluates product data across four dimensions. Each represents a different question an AI engine needs to answer before including a product in a recommendation. The scores tell you where a product's data is sufficient, and where it falls short.
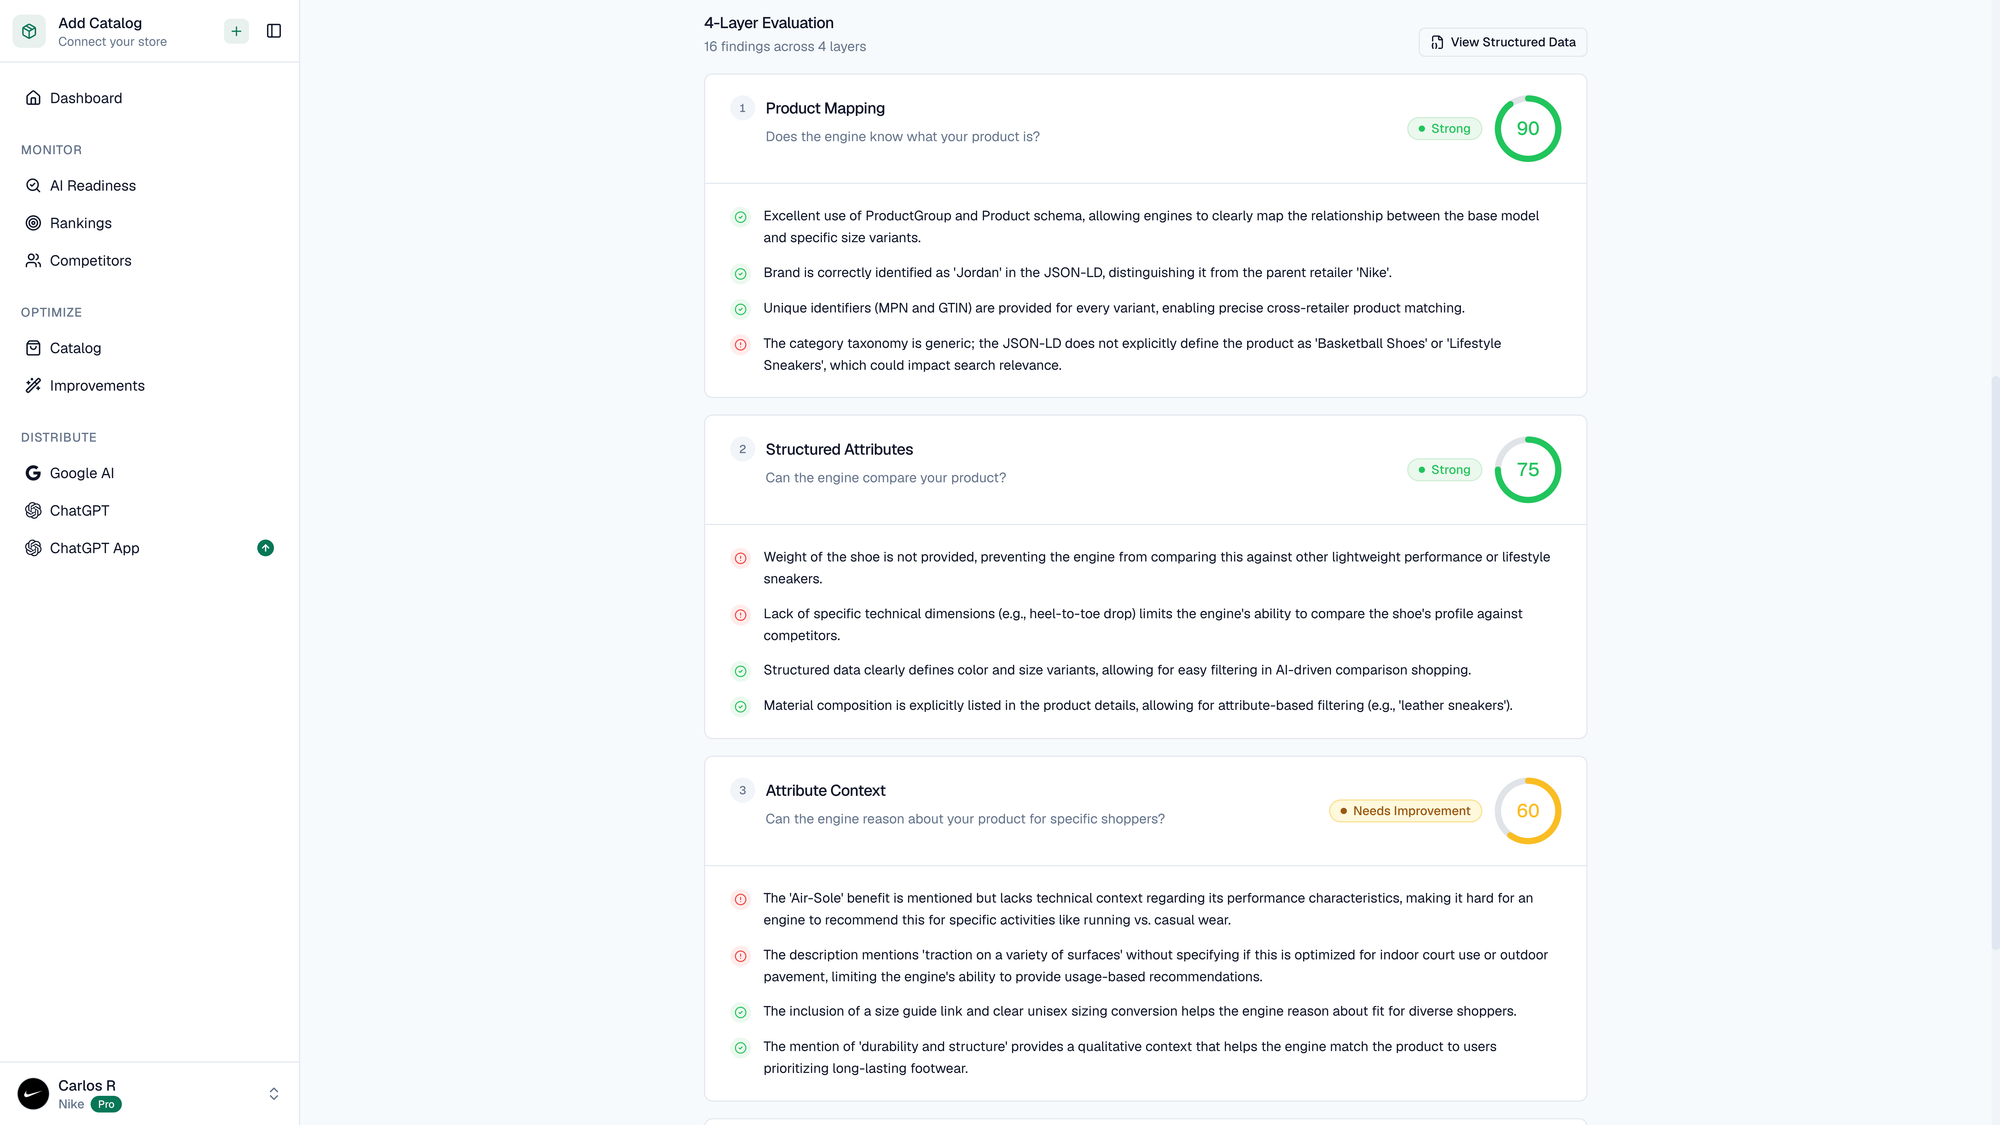
Layer 1 — Product Mapping: 91 (Strong)
Does the engine know what this product is?
This is the foundation. If the AI can't correctly identify and categorize your product, nothing else matters.
The Jordan 1 Mid scores 91 here. Near perfect. Nike's product page uses ProductGroup and Product schema correctly, letting engines map the relationship between the base model and its size/color variants. The brand is identified as "Jordan" in the JSON-LD, distinct from the parent retailer Nike. Every variant has unique identifiers (MPNs and GTINs) for cross-retailer matching.
The one finding that prevents a perfect score: the category taxonomy is generic. The structured data doesn't explicitly classify this as "Basketball Shoes" or "Lifestyle Sneakers." When a shopper asks for "the best basketball shoes," this gap could mean the engine has to infer the category from other signals rather than reading it directly.
Layer 2 — Structured Attributes: 75 (Strong)
Can the engine compare this product against alternatives?
This layer measures whether the product data contains the structured attributes engines need for side-by-side comparisons.
At 75, the Jordan 1 Mid is solid but has gaps. Color and size variants are structured, which supports comparison shopping. Material composition (leather, synthetic leather) is explicitly stated, so when someone asks for "leather sneakers," the engine can filter accurately.
But weight isn't listed anywhere. When an engine is comparing lightweight shoes, it can't include the Jordan 1 Mid in that evaluation because the data simply isn't there. Same for heel-to-toe drop and other technical specs that performance-focused shoppers care about. These are the attributes that determine whether your product shows up in comparison queries.
Layer 3 — Attribute Context: 59 (Needs Improvement)
Can the engine reason about this product for a specific shopper?
This is where even Nike falls below the bar. A score of 59 flags this layer as "Needs Improvement," the only layer in the report that drops out of the Strong range.
The product page mentions "flat-foot benefit" but doesn't provide technical context about what that means for performance. Is it relevant for casual daily wear? Running? Basketball? The description references "traction on a variety of surfaces" without specifying whether that means indoor hardwood or outdoor concrete. These are the contextual details an AI engine needs when matching a product to a specific question like "best sneakers for everyday wear" versus "best basketball shoes for indoor courts."
The findings here explain something specific about Nike's monitoring data: the visibility score of 7/10, while strong, has room to grow. When attribute context is thin, engines can still include the product (because the mapping and attributes are excellent), but they may rank it lower or hedge their recommendation. Fixing this layer is the difference between "Nike is a good option" and "the Jordan 1 Mid is the best choice for your specific need."
Layer 4 — Product Context: 80 (Strong)
Does the engine have enough confidence to recommend this product?
This layer evaluates the trust signals surrounding the product: the evidence an AI engine needs to recommend it.
The Jordan 1 Mid scores 80 here, driven by 2,186 reviews with a 4.5-star average. That's social proof engines trust. The structured data also includes clear in-stock availability and well-defined shipping and return policies. Both are trust signals AI shopping agents weigh when deciding whether to include a product.
One interesting finding from this layer: there's a recurring pattern in negative reviews about sole durability ("sole apart around the heel") that goes unaddressed by the manufacturer. Our analysis flags this because AI engines can detect sentiment patterns in reviews. Unanswered quality concerns can erode the confidence score an engine assigns to a product over time.
What 78 out of 100 actually tells us
Nike's Air Jordan 1 Mid scores 78. That's enough to lead a category of 50+ competitors. Sit with that for a moment.
If the category leader, a brand with the resources and e-commerce infrastructure Nike has, a product page most would consider "good," scores 78, what does the rest of the landscape look like?
Based on the reports we've run across hundreds of products, most brands operate in the 40–60 range. Many are below 40. The gap between "included in AI recommendations" and "excluded entirely" often comes down to whether your structured data has the right schema, whether your attributes are machine-readable, and whether your product descriptions answer the questions AI engines actually need answered.
A few things this analysis clarified for me:
The bar is low, but rising. Today, 78 is enough to lead. It won't be in a year. As more brands invest in their product data, the threshold for inclusion will move up. The brands that optimize now, while the bar is still low enough to clear, will compound their advantage.
Even the best have blind spots. Nike's Attribute Context score of 59 is the most telling data point here. Use-case-specific descriptions, the kind that connect a spec to a shopping scenario, remain underinvested even by well-resourced teams. This layer is the highest-leverage fix for any brand, because almost nobody is doing it perfect.
Brand recognition doesn't guarantee AI visibility. In AI shopping, what gets you included is the data attached to each product. The engine evaluates the product card.
The competitive data is specific enough to act on. When you can see the exact query where your competitor wins and you don't, and on which platform, that's a gap with a clear fix: improve the product data for that query context.
Getting started
If you're curious where your own products stand, we built a free AI readiness report that runs this same four-layer analysis on any product URL. Takes about 30 seconds, no account required. Paste a URL, get a score, see exactly where your data falls short.
Whether you're leading your category or just starting to pay attention to AI commerce, the underlying question is the same: when ChatGPT, Google AI, or Perplexity evaluates your product data, does it have what it needs to include you?
For most brands, the honest answer is: not yet. And the uncomfortable part is that you won't know it until you look.
Carlos Raimundo is VP Product at Paz.ai, where he works on AI visibility monitoring and catalog optimization for e-commerce brands.
How AI-ready are your products?
Check how ChatGPT, Google AI, and Perplexity evaluate any product page. Free score in 30 seconds.